
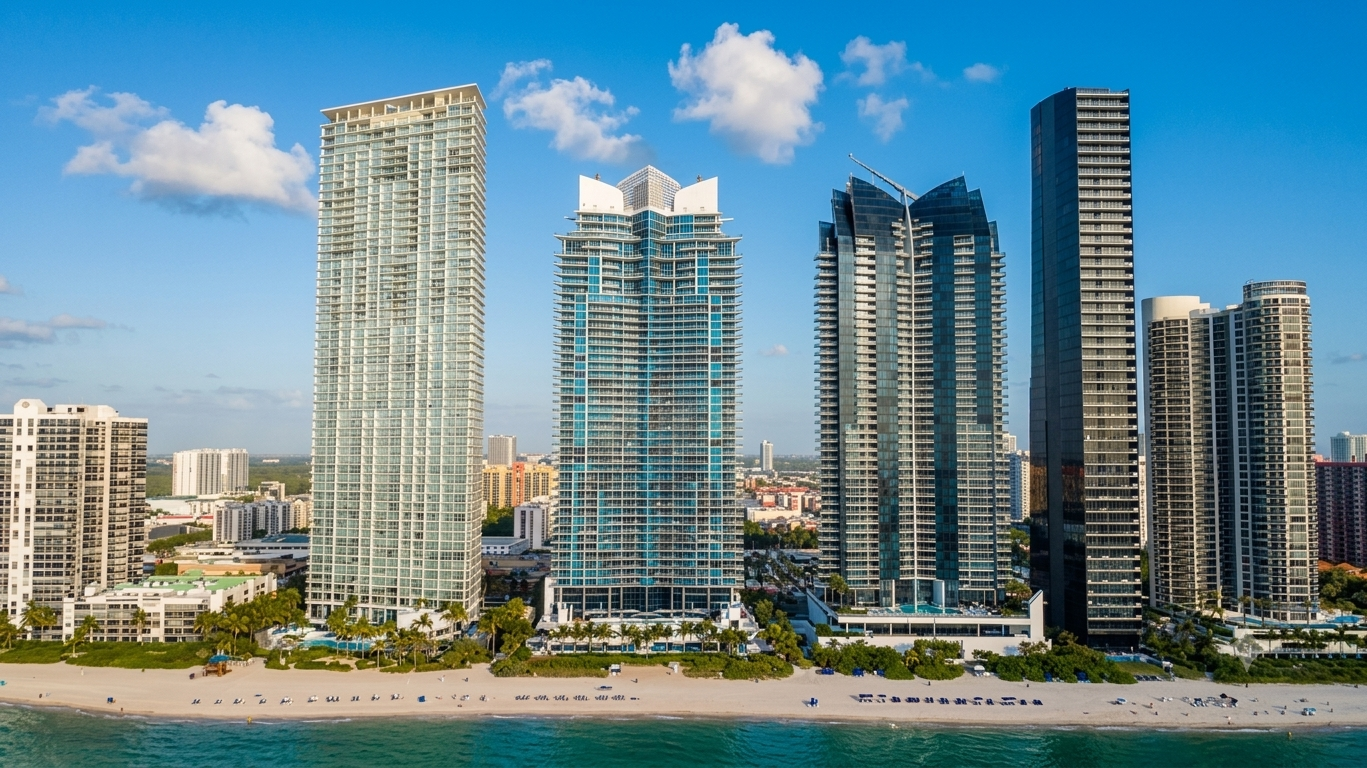
Every month, I pull the TrendGraphix market reports for Jade Beach and Jade Ocean directly from MLS data. This month’s numbers tell a more interesting story than a simple “both buildings are in a buyer’s market” summary would suggest. The top-line conditions are similar. The details are not.
Here is what the data actually shows — and what it means if you’re buying or selling at either building right now.
Source: Facts and Trends™ Published July 2026, TrendGraphix Inc. / Southeast Florida MLS. Price range filtered $900,000+.
The Headline Numbers: Both Buildings Confirmed Buyer’s Markets
Both Jade Beach and Jade Ocean are firmly in buyer’s market territory as of June 2026 — defined as more than 6 months of inventory based on closed sales. That much is consistent.
| Metric | Jade Beach | Jade Ocean |
|---|---|---|
| Active Listings (Jun. 26) | 15 | 10 |
| Sold (Jun. 26) | 1 | 1 |
| Pended (Jun. 26) | 1 | 0 |
| Months of Inventory | 15 | 10 |
| Avg. Days on Market | 50 | 101 |
| Sold/Orig LP % | 95% | 94% |
| Avg. Sold Price/SqFt | $1,381 | $1,282 |
| Market Condition | Buyer’s Market | Buyer’s Market |
Both buildings confirm what we’ve been telling buyers since Day 1 of this content run: inventory is elevated, transaction volume is thin, and the negotiating environment strongly favors buyers. That thesis is now MLS-sourced and current as of July 2026.
Where the Story Gets Interesting: The Divergence
Look past the headline conditions, and the two buildings are telling meaningfully different stories.
Jade Beach: Fewer Days, Higher $/SqFt, Appreciating Trend
Average days on market at Jade Beach in June 2026: 50 days.
That is a genuinely short days-on-market number for a building in a confirmed buyer’s market with 15 months of inventory. It suggests that when a Jade Beach unit is correctly priced, it moves — the buyer pool is there, it’s just price-sensitive.
The price-per-square-foot data reinforces this. Jade Beach’s average sold price per square foot in June 2026 was $1,381, and the TrendGraphix 6-month trend classification for that figure is Appreciating. Year-to-date, Jade Beach’s price per square foot is up 15.4% compared to the same period last year ($1,312 vs. $1,137).
The average sold price in June 2026 was $3,965,000, which reflects a higher-end unit transacting rather than an entry-level sale, consistent with a market where only one unit sold in the month.
The Sold/Original List Price ratio at Jade Beach was 95% — meaning the June 2026 buyer paid 95 cents on the original asking dollar. That is a relatively tight spread for a buyer’s market and signals that Jade Beach sellers who price correctly are not getting dramatically discounted.
Jade Ocean: More Days, Lower $/SqFt, Neutral Trend — But Something Important Underneath
Average days on market at Jade Ocean in June 2026: 101 days.
Double the Jade Beach figure. That gap is meaningful — it tells you that Jade Ocean units are sitting longer before buyers commit, which reflects both the building’s higher average active price ($2,965,000 vs. $3,218,000 at Jade Beach — yes, Jade Beach’s average active price is actually higher right now) and a somewhat thinner buyer pool for this specific building in this specific month.
Jade Ocean’s average sold price per square foot in June 2026 was $1,282 — below Jade Beach’s $1,381, and the TrendGraphix trend classification is Neutral rather than Appreciating. Year-to-date, Jade Ocean’s average price per square foot is essentially flat at $1,434 vs. $1,425 the prior year — a 0.6% gain.
The Sold/Original List Price ratio at Jade Ocean was 94% — one point below Jade Beach, consistent with slightly more negotiating room.
The Counterintuitive Finding: Jade Beach’s Active Prices Are Higher
Here is the data point that will surprise most buyers who assume Jade Ocean commands a premium over Jade Beach across the board:
As of July 2026, the average active listing price at Jade Beach ($3,218,000) is higher than at Jade Ocean ($2,965,000).
This is not a pricing error. It reflects the composition of what’s currently listed at each building. Jade Beach’s active inventory appears to be weighted toward larger, higher-value units right now — four-bedroom and penthouse listings pulling the average up — while Jade Ocean’s active inventory includes more mid-tier two and three-bedroom units.
For buyers, this has an important practical implication: the “Jade Ocean costs more than Jade Beach” assumption is not universally true in the current market. Shopping both buildings with a specific budget and bedroom count is more important than assuming one building is categorically more or less expensive.
Inventory Trend: Both Buildings Are Tightening
One signal in this data that buyers should not ignore: inventory at both buildings has declined significantly year-over-year.
| Metric | Jade Beach | Jade Ocean |
|---|---|---|
| Active Listings Jun. 25 | 20 | 24 |
| Active Listings Jun. 26 | 15 | 10 |
| YoY Change | -25% | -58.3% |
Jade Ocean’s active inventory has dropped by more than half compared to a year ago. Jade Beach is down 25%. Both buildings have fewer listings today than they did twelve months ago, which means the buyer’s market, while still confirmed, has less supply than it did at its peak.
This matters for buyers who have been waiting for conditions to deteriorate further before acting. The inventory data suggests the opposite is happening — supply is contracting, not expanding. The buyer’s market window is real, but it is narrowing at the inventory level even if transaction volume remains thin.
What This Means for Buyers
If you are targeting Jade Beach, the data supports moving with measured urgency. Days on market of 50 days and a 95% sold-to-original-list-price ratio mean correctly priced units don’t sit forever. The appreciating price-per-square-foot trend is a real signal — at a YTD gain of 15.4%, buyers who wait may be paying more per square foot by year’s end, not less.
If you are targeting Jade Ocean, you have more time and more negotiating room than a Jade Beach buyer in the current data. Units are averaging 101 days on market, and the price-per-square-foot trend is neutral rather than appreciating. The 94% sold-to-original-list ratio gives you 6 points of negotiating room as a starting position — meaningful at the $2M–$4M price tier.
For both buildings, the inventory contraction story is the most important macro signal in this data. Both buildings have meaningfully less supply than a year ago. If that trend continues into the October–April peak season, the buyer’s market conditions of mid-2026 may look considerably tighter by Q1 2027.
For updated late-2026 pricing at the two million dollar mark, see What $2 Million Buys at Jade Beach and Jade Ocean in Late 2026.
What This Means for Sellers
At Jade Beach: Your building’s data is genuinely encouraging relative to the buyer’s market narrative. Appreciating price-per-square-foot, 50-day average DOM, and 95% of original list price achieved are all stronger metrics than sellers in a 15-month inventory market would normally expect. Price correctly — meaning at current comp levels, not 2022 peak levels — and your unit has a realistic path to a clean transaction in a reasonable timeframe.
At Jade Ocean: The 101-day average DOM and neutral price trend are honest signals to price with more conservatism than you might want to. The inventory contraction (down 58% year-over-year) is actually an argument for listing now while competing supply is thin — a correctly priced unit has fewer competing listings than it would have had twelve months ago, which is a genuine seller advantage even in a buyer’s market.
Update, October 2026: Q3 closed sales data is now available for both buildings. See the full breakdown in Jade Beach and Jade Ocean Market Update: Q3 2026.June 2026 MLS Data Summary: Jade Beach vs. Jade Ocean
Jade Beach — June 2026
- Active listings: 15 (down 25% year-over-year)
- Homes sold: 1 | Pended: 1
- Average sold price: $3,965,000
- Average sold price per sq ft: $1,381 (Appreciating — up 15.4% YTD)
- Average days on market: 50
- Sold/original list price ratio: 95%
- Months of inventory: 15
- Market condition: Buyer’s market
Jade Ocean — June 2026
- Active listings: 10 (down 58.3% year-over-year)
- Homes sold: 1 | Pended: 0
- Average sold price: $1,100,000
- Average sold price per sq ft: $1,282 (Neutral — up 0.6% YTD)
- Average days on market: 101
- Sold/original list price ratio: 94%
- Months of inventory: 10
- Market condition: Buyer’s market
Source: Facts and Trends™ Published July 2026, TrendGraphix Inc. / Southeast Florida MLS.

Frequently Asked Questions
Is Jade Beach or Jade Ocean a better buy in July 2026?
The MLS data suggests Jade Beach’s price-per-square-foot trend (Appreciating, up 15.4% YTD) and faster days on market (50 days) make it the more active market of the two right now. Jade Ocean offers more negotiating room (101 days on market, neutral price trend) but also has a thinner buyer pool. The right choice still depends on your investment thesis and lifestyle priorities — but the data gives Jade Beach a slight near-term momentum edge.
Are prices going up or down at Jade Beach in 2026?
The TrendGraphix trend classification for Jade Beach’s price per square foot as of June 2026 is Appreciating — up 15.4% year-to-date compared to the same period in 2025 ($1,312 vs. $1,137/sq ft). This is a genuine positive signal in a market otherwise characterized as a buyer’s market.
Are prices going up or down at Jade Ocean in 2026?
Jade Ocean’s price per square foot trend is classified as Neutral as of June 2026 — essentially flat year-over-year at $1,434 vs. $1,425/sq ft. The single June sale at $1,282/sq ft reflects a one-transaction sample in a thin month and should be read in the context of the YTD average.
Why does Jade Beach show a higher average active price than Jade Ocean?
The current listing composition at Jade Beach is weighted toward larger, higher-value units, pulling its average active price ($3,218,000) above Jade Ocean’s ($2,965,000). This is a snapshot of what’s currently for sale, not a permanent structural reversal — but it does mean that assuming Jade Ocean universally costs more than Jade Beach is not accurate in the current market.
Is inventory increasing or decreasing at the Jade buildings?
Decreasing — meaningfully. Jade Beach active inventory is down 25% year-over-year; Jade Ocean is down 58.3%. This inventory contraction is occurring while both buildings remain in buyer’s market territory, suggesting the market is normalizing from its peak-inventory levels of 2025 toward a more balanced state.
Current Listings and Market Intelligence
If you’ve been tracking either building and want to know what’s actually available right now — including units not yet on the public MLS — the conversation starts here.
Call or text: 305.978.7704
Email: AColeman@onesothebysrealty.com
Schedule a conversation →
Related reading:
Jade Condos 2026 Mid-Year Market Report | Jade Beach vs. Jade Ocean Deep Dive | Jade Condos Market Values | What $2 Million Buys at the Jade Condos